If you have github command installed, you can simply install the package by typing:
github install haghish/neat
Otherwise, you can install it using net install command as shown below:
net install github, replace from("https://raw.githubusercontent.com/haghish/neat/master/")
The command simply takes 2 Stata variables along with the options required for adjusting the size of a scatterplot graph in Stata. The command alters the values of the variables in a way to create geometrically appealing shapes out of replicated observations in scatter plots. Therefore, the command should be followed by a scatterplot command in Stata.
Let's load an example dataset that has replicated observations for 2 variables.
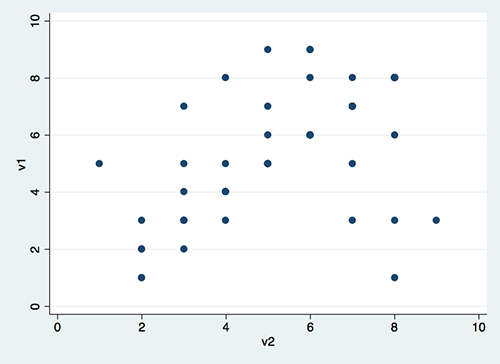
the neat3.dta includes 2 discrete variables named v1 and v2. Let's begin by creating a scatter plot in Stata:
.  use "https://raw.githubusercontent.com/haghish/neat/master/test/neat3.dta", clear
.  scatter v1 v2
Now let's apply the neat engine. This will change the duplicated
observations in v1 and v2 variables.
.  neat v1 v2
.  scatter v1 v2

The neat layout engine takes several options which are identical to
the options of the scatter command in Stata, used for altering the
size of symbols, width of the graph, and height of the graph. If you
wish to alter the default size of the scatter plot in Stata, you can
apply the same options to the neat engine, so that it takes the final
shape of the scatter plot into account, when it calculates the
geometiric distances between the duplicated observations.
For example, let's assume you wish to reduce the size of the symbols in
the previous figure. You can use the msize(num) option to change the
size of the symbil. For this, you should give the option a real number.
For example, 1.1, which is smaller than the default value of the
msize (i.e. 1.5).
We can also alter the size of the graph. For instance, let's make the graph wider by changing the __xsize to 6.5, which is larger than the default value (i.e. 5.5):
 .  use "https://raw.githubusercontent.com/haghish/neat/master/test/neat3.dta", clear
 . neat v1 v2 , msize(1.1) xsize(6.5)
 . scatter v1 v2, msize(1.1) xsize(6.5)

Despite the scalings, the graph still looks fine and the geometric shapes are in place. Now let's alter another variable, the dsize option which increases the distance between the geometric shapes, resulting in larger shapes. The default value is 5, so we can try 7!
 . use "https://raw.githubusercontent.com/haghish/neat/master/test/neat3.dta", clear
 . neat v1 v2 , dsize(7)
 . scatter v1 v2

E. F. Haghish
Center for Medical Biometry and Medical Informatics
University of Freiburg, Germany
haghish@imbi.uni-freiburg.de
http://www.haghish.com/weaver
@Haghish