- Database profiler overview
- Profiler demo: helper
- Profiler demo: examining system profiler operations
- Profiler demo: filtering by timestamp
- Examining log files
- Log files are noisy
- Filtering out connections from log files
- Grepping log files
- Examining connections in log files
- Introducing mtools
- mtools: mlaunch
- mtools: mloginfo
- mtools: mlogfilter
- mtools: mplotqueries
Download, extract, and examine the log files in the attachment. These are the log files for four servers that were (by the end of the logs) spun up into a single replica set.
Initially, there was a problem with one or more server configuration options. In the log file(s), find the configuration setting that is initially causing the issue.
Enter the field name (not the value) for the setting that is the source of the problem. Do not use numbers, quotation marks, or other punctuation in your answer. For example, if you thought the answer was "logAppend": true (which it definitely isn't), you would type:
logAppend
When you have your answer, please paste or type it into the box below, and submit. Unfortunately, case/capitalization matters here, so please enter the field name for the setting in question exactly how it appears in the logs.
- Download Handouts and untar it. Answer is 'bindIp'.
In this problem, you will examine a log file with mtools and determine what is causing problems.
Download and unpack the handout, then find the namespace and the query pattern (called the "query shape" by the docs) that the server has cumulatively spent the most time working on. You'll want to use mloginfo for this step. To help ensure that you're on the right track, this will be the namespace and query pattern that has taken, cumulatively, 2038017 ms of operation time in this log file, or a little under 34 minutes.
If you've ran the correct command your output should look similar to the following:
namespace               pattern                              count   min (ms)   max (ms)   mean (ms)   95%-ile (ms)   sum (ms)
website.pageview        {"page": 1, "count": {"$gte": 1}}     3350         21        871         116          386.0     390638
website.users           {"_id": 1}                            2299         23        129          33           82.0      76223
Unless you are already familiar with mloginfo, you may want to examine the docs.
When you have the answer, please enter the pattern from your results. In the example above, you would enter { "page" : 1, "count" : { "$gte" : 1 } }.
- Download Handouts and untar it.
- Run mloginfo
$ mloginfo --queries mtools_example.log
     source: mtools_example.log
       host: unknown
      start: 2014 Jun 21 00:11:00.041
        end: 2014 Jun 21 00:12:59.999
date format: iso8601-utc
     length: 174406
     binary: unknown
    version: = 2.6.x (iso8601 format)
    storage: unknown

QUERIES

namespace                            operation        pattern                              count    min (ms)    max (ms)    mean (ms)    95%-ile (ms)    sum (ms)
grilled.indigo.papaya                update           {"_id": 1, "l": {"$not": 1}}         4227           0        3872          482          1189.4    2038017
grilled.indigo.grapefruit            update           {"_id": 1}                           1170           0        2516          479         1196.85    560682
grilled.indigo.salal.berry           update           {"clusterId": 1}                     843           0        2805          502          1385.0    423825
grilled.indigo.papaya                update           {"_id": 1}                           4760           0        2557           82          583.15    393992
grilled.indigo.papaya                remove           {"_id": 1}                           716           0        2544          462          1066.5    331478
grilled.indigo.tangerine             update           {"_id": 1}                           380           0        3037          484          1144.2    184188
...
Answer is the first element {"_id": 1, "l": {"$not": 1}}.
Once you've got the namespace and query pattern from the previous problem, use mlogfilter to filter the log file to get only those queries that match both the namespace and the query pattern, and then use mplotqueries to look at the queries in one-second buckets. To make sure you're doing things right, your results should look like this:
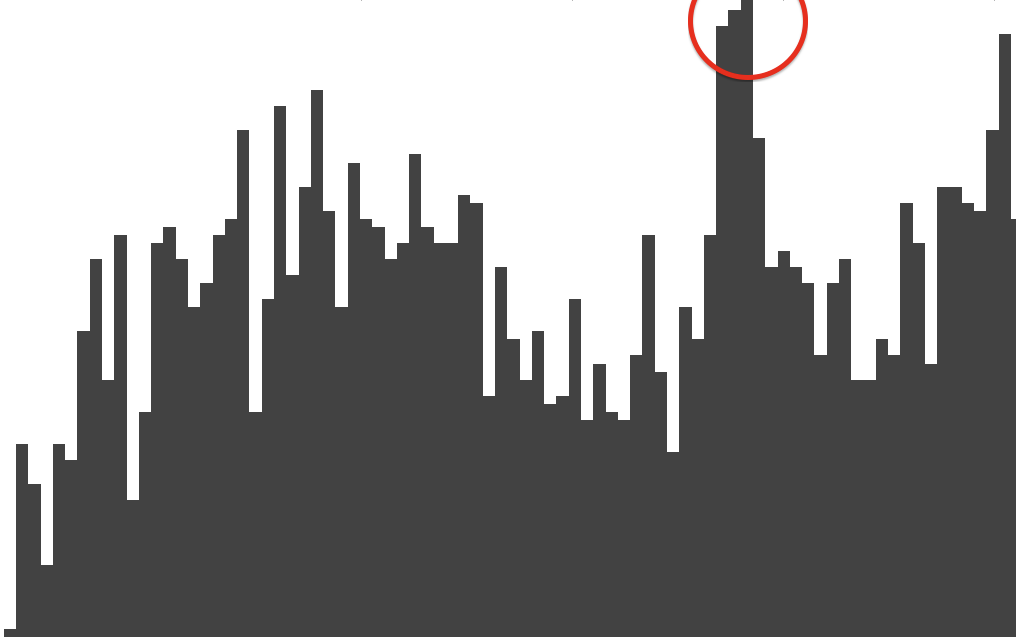
Your results will have their axes labeled. Examine the highest peak. You can either compare it to the y-axis, or click on it to find out the value.
Your question is this: What is the number of these operations during that one-second bin with the highest peak?
Hint: If you're unfamiliar with the bash commands, you might want, as an intermediate step, to create a new log file. By default, mlogfilter sends its results to stdout, but you can redirect it to a new file by appending > newfile_name to the end of the command.
- Download Handouts and untar it.
- Filter log
mlogfilter --namespace grilled.indigo.papaya --pattern '{"_id": 1, "l": {"$not": 1}}'  \
    mtools_example.log > mtools_example.log_filtered
- Create image with mplotqueries
mplotqueries --type histogram mtools_example.log_filtered --bucketsize 1
Answer will be 60-90 ops/s