
HTTP benchmarking is a useful technique for evaluating the performance of websites and web applications. It measures how quickly a server responds to requests from users. This is important for making sure that the online experience is smooth. This document explains the principles and processes of HTTP benchmarking.
This document is made to be simple and easy to follow, so it is suitable for people who are just starting to learn about the topic. Whether you are a developer, a system administrator, or just interested in web performance, you will discover clear explanations and simple ideas that will help you understand the basics of HTTP benchmarking.
Benchmarking is the act of assessing how well a system, application, or process performs compared to a specific standard or criteria. This process includes analyzing different metrics to find ways to improve and to confirm that performance meets or goes beyond what is expected. In technology, benchmarking allows organizations to evaluate how efficient and effective their systems are, helping them make smart choices about improvements and upgrades.
HTTP, which stands for Hypertext Transfer Protocol, is the key protocol that allows data to be sent over the internet. It specifies the format of messages and how they should be sent, along with the way web servers and browsers should react to different requests. It works on a request-response system, where a client makes a request to a server, and the server replies with the information that was asked for.
It is advisable to read this page, even if you have a basic understanding of the HTTP protocol.
https://www.w3schools.com/whatis/whatis_http.asp
The HTTP benchmarking process involves a client (the benchmarking tool) sending multiple requests to a web server over the network. The client first connects to the server, then sends the HTTP requests. The server receives the requests, processes them, and sends responses back to the client. The client receives and processes the responses. The benchmarking tool repeats this process, sending many requests concurrently, and measures the server's performance, such as response times, the number of successful and failed requests, and the overall throughput.
This simple diagram illustrates the overall functioning of HTTP benchmarking:
+---------------+
|  Benchmarking |
|     Tool      |
+---------------+
     |
     |  Concurrent Requests
     v
+---------------+
|  Web Server   |
+---------------+
     |
     |  Responses
     v
+---------------+
|  Benchmarking |
|     Tool      |
+---------------+
     |
     |  Measure Performance
     v
+---------------+
|  Benchmarking |
|    Results    |
+---------------+
     |
     |  Repeat Process
     v
Think of a busy restaurant that wants to see how well it can serve many customers at once. This is like how HTTP benchmarking tools test web applications and servers. Just as a restaurant needs to manage a certain number of guests, web servers must handle a specific amount of traffic or users at the same time. HTTP benchmarking tools simulate these users by sending many requests to the server at once to check its performance. By creating different traffic levels, these tools help find out how much load the web server or application can handle, similar to how a restaurant owner would want to know the highest number of customers they can accommodate. Just like a restaurant might host a big event to test its limits, HTTP benchmarking tools help stress-test web systems to find any performance problems before they affect actual users.
When a user tries to manually send requests to a web server, they are limited by their own physical and cognitive abilities. A single user can only send a relatively small number of requests in a short period, which does not accurately represent the real-world usage patterns of a web application. In contrast, HTTP benchmarking tools are designed to simulate thousands or even millions of concurrent users, generating a massive volume of requests that a human user could never match.
These tools use specialized algorithms and techniques to create a high-intensity, sustained load on the web server or application. They can simulate multiple client connections, varying request types, and complex user behavior patterns, all while collecting detailed performance metrics. This level of load generation and data collection is simply not feasible for a human user to replicate manually.
By using an HTTP benchmarking tool, you can push the web server or application to its limits, testing its ability to handle peak loads and identifying potential bottlenecks or performance issues. This is essential for ensuring that your web application can scale to meet the demands of your user base, even during periods of high traffic or unexpected spikes in activity.
You don't need to fully understand HTTP benchmarking with conceptual models, but it's good to have a basic grasp of at least one conceptual model.
In the following sections, we will explore HTTP benchmarking through two well-known network conceptual models.
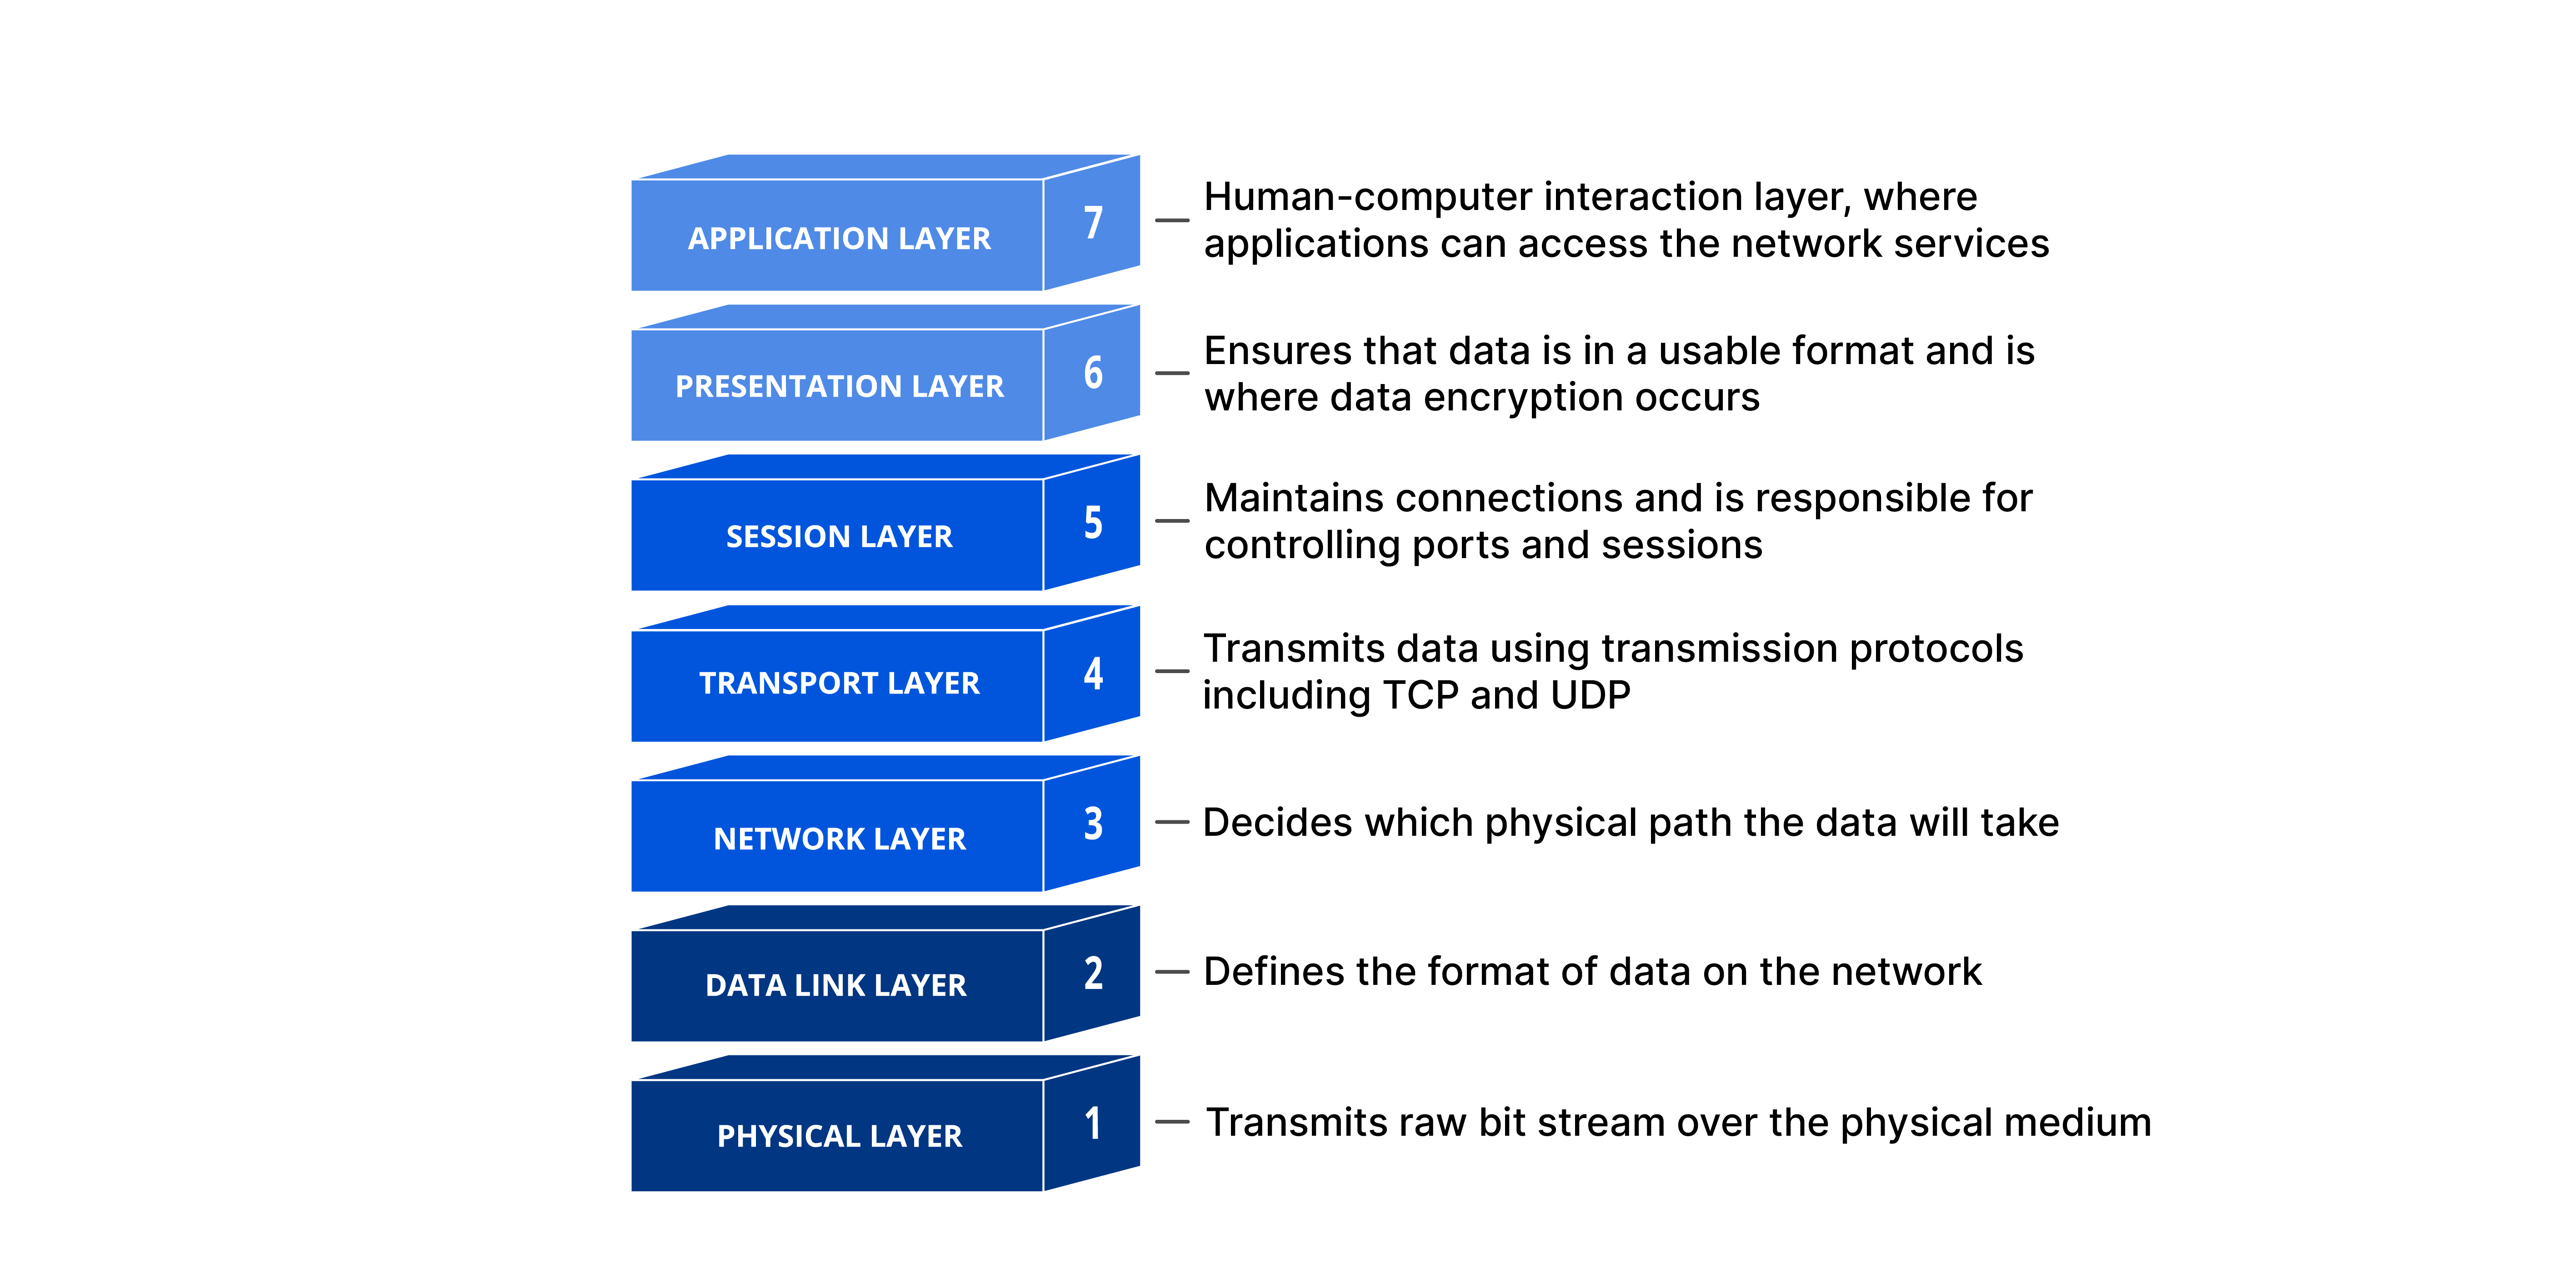
When doing HTTP benchmarking in the OSI model, it involves all seven layers. At the physical layer, the tool creates signals to send HTTP requests through the network. The data link layer organizes these requests into frames for safe and accurate data transfer. The network layer finds the best routes, while the transport layer manages flow control, breaks data into segments, and fixes errors. The session layer oversees the communication, and the presentation layer makes sure the data is formatted and encrypted correctly. Lastly, the application layer contains the HTTP protocol and the web server's functions, enabling the tool to create the actual requests.
In the context of the TCP/IP model, the HTTP benchmarking tool primarily operates at the transport and application layers. At the transport layer, the tool uses protocols like TCP to ensure the reliable and ordered delivery of HTTP requests to the web server. At the application layer, the tool generates the actual HTTP requests, adhering to the protocol specifications. The lower layers, such as the link layer and the internet layer, handle the underlying network functionality, including framing, addressing, and routing, to ensure that the requests reach the target web server.
To use an HTTP benchmarking tool effectively, you need to grasp three essential key concepts. While there are many ideas related to these tools, this document will focus on explaining just these three main concepts.
The connections setting in an HTTP benchmarking tool determines how many connections the tool will open to the server at once. This mimics many users using the application together. More connections mean the tool is simulating more users at the same time, helping you see how the server performs as user numbers grow. For instance, if you set the connections to 100, the tool will keep 100 active connections to the server during the test, showing you how the server manages that amount of activity.
The thread settings determine how many worker processes the benchmarking tool will employ to create load. Each thread can handle its own connections, enabling the tool to produce a greater total load on the server. More threads allow the tool to mimic more users and requests compared to using just one thread. This ability to run multiple threads is crucial for creating realistic load scenarios and assessing the server's scalability. For example, if you set the threads to 4, the tool will operate with 4 distinct worker processes to manage the connections and requests.
The duration setting determines how long the benchmarking test will last. A longer duration allows for more requests to be sent to the server, leading to a better performance assessment. You can set the duration in seconds, minutes, or hours based on what the test requires. For instance, a 30-second duration will create a specific number of requests, while a 30-minute duration will produce many more, helping you see how the server performs over time under stress.
Numerous HTTP benchmarking tools are available. In this section of the document, we will perform HTTP benchmarking using a tool called 'wrk' and analyze the results.
You can find all the details about this tool in the link below.
https://github.com/wg/wrk
In this case, a website has been set up locally with a python http server, which is located at the address:
http://192.168.1.101:8000/index.html
We are going to perform a 1-minute benchmark using 5 threads while keeping 50 HTTP connections open. To achieve this with the 'wrk' tool, we should execute the following command.
wrk -t5 -c50 -d1m http://192.168.1.101:8000/index.html
Once we run the command above, we will see this output, indicating the beginning of the HTTP benchmark.
Running 1m test @ http://192.168.1.101:8000/index.html
  5 threads and 50 connections
It's fascinating to look at the python http server logs after running the HTTP benchmark, which are shown below.
As you see, the log indicates that a user has been consistently trying to access the same web page. All the requests originated from the same local IP address and were successful, which means the server managed to deliver the requested page every time.
192.168.1.101 - - [18/Aug/2024 22:58:38] "GET /index.html HTTP/1.1" 200 -
192.168.1.101 - - [18/Aug/2024 22:58:38] "GET /index.html HTTP/1.1" 200 -
192.168.1.101 - - [18/Aug/2024 22:58:38] "GET /index.html HTTP/1.1" 200 -
192.168.1.101 - - [18/Aug/2024 22:58:38] "GET /index.html HTTP/1.1" 200 -
192.168.1.101 - - [18/Aug/2024 22:58:38] "GET /index.html HTTP/1.1" 200 -
192.168.1.101 - - [18/Aug/2024 22:58:38] "GET /index.html HTTP/1.1" 200 -
192.168.1.101 - - [18/Aug/2024 22:58:38] "GET /index.html HTTP/1.1" 200 -
192.168.1.101 - - [18/Aug/2024 22:58:38] "GET /index.html HTTP/1.1" 200 -
192.168.1.101 - - [18/Aug/2024 22:58:38] "GET /index.html HTTP/1.1" 200 -
192.168.1.101 - - [18/Aug/2024 22:58:38] "GET /index.html HTTP/1.1" 200 -
192.168.1.101 - - [18/Aug/2024 22:58:38] "GET /index.html HTTP/1.1" 200 -
192.168.1.101 - - [18/Aug/2024 22:58:39] "GET /index.html HTTP/1.1" 200 -
192.168.1.101 - - [18/Aug/2024 22:58:39] "GET /index.html HTTP/1.1" 200 -
192.168.1.101 - - [18/Aug/2024 22:58:39] "GET /index.html HTTP/1.1" 200 -
192.168.1.101 - - [18/Aug/2024 22:58:39] "GET /index.html HTTP/1.1" 200 -
After a minute, the HTTP Benchmark ends, and here the result is as follows.
Thread Stats   Avg      Stdev     Max   +/- Stdev
    Latency    13.37ms   54.21ms   1.66s    98.55%
    Req/Sec   141.12    128.77     1.06k    89.50%
  39530 requests in 1.00m, 823.53MB read
  Socket errors: connect 0, read 0, write 0, timeout 19
Requests/sec:    657.88
Transfer/sec:     13.71MB
We are now looking to thoroughly analyze the results of this HTTP benchmark. The key metrics include latency, requests per second, and error rates, which together offer insights into how well the server handles incoming traffic.
Latency is a critical measure of performance, with an average of 13.37 milliseconds reported in this test. This indicates that, on average, requests are processed relatively quickly. However, the standard deviation of 54.21 milliseconds suggests significant variability in response times, meaning that while most requests are handled promptly, some experience much longer delays. The maximum latency recorded was 1.66 seconds, which is notably high and could point to potential bottlenecks or performance issues during peak loads. The percentage of requests falling within one standard deviation of the average latency is 98.55%, indicating that the majority of requests are consistent in their response times, but the outliers may need further investigation.
In terms of throughput, the server processed an average of 141.12 requests per second, with a maximum of 1,060 requests per second during the test. The standard deviation of 128.77 requests per second indicates variability in how many requests the server can handle at different times. The overall performance shows that a total of 39,530 requests were completed in one minute, with 823.53 megabytes of data transferred. This suggests that the server is capable of managing a substantial amount of traffic and data.
Error rates are also an important aspect of the benchmark results. Notably, there were no connection, read, or write errors, which is a positive sign of the server's reliability. However, there were 19 timeout errors, indicating that some requests took too long to process and were ultimately abandoned. This could suggest that under certain conditions, the server may struggle to maintain performance, particularly during peak loads.
In summary, the benchmark results indicate that the server performs well overall, with a good average latency and high throughput. However, the high standard deviation in latency and the presence of timeout errors suggest that there may be inconsistencies in performance that could be addressed. Optimizing the server's handling of requests could lead to improved reliability and faster response times, particularly during periods of high demand.
This was an example of HTTP benchmark result analysis that was done for your better understanding of this issue.
This document explains the key points of HTTP benchmarking. You now understand what it is, how it functions, and its significance for web application performance.
We began by defining important terms like "benchmarking" and "HTTP," which set the stage for the rest of the information. Then, we looked at the process of HTTP benchmarking, detailing how a client (the benchmarking tool) works with a web server to assess its performance.
Next, we examined the purpose of HTTP benchmarking tools, emphasizing their capability to mimic real user actions and stress-test web applications in ways that manual testing cannot achieve.
Finally, we covered the important concepts you need to know when using these tools, such as connections, threads, and duration. Grasping these aspects will help you set up and understand the results of your HTTP benchmarks effectively.